I the last weeks I used Fiddler [1] to see what is sent over the lines on initial start of a web site and during the web application is running. You can simply mark more than on request line. On the right side you will then see in the Performance Statistics how many bytes are received from the client.
When you have a look at Live.com [2] you will have this result:
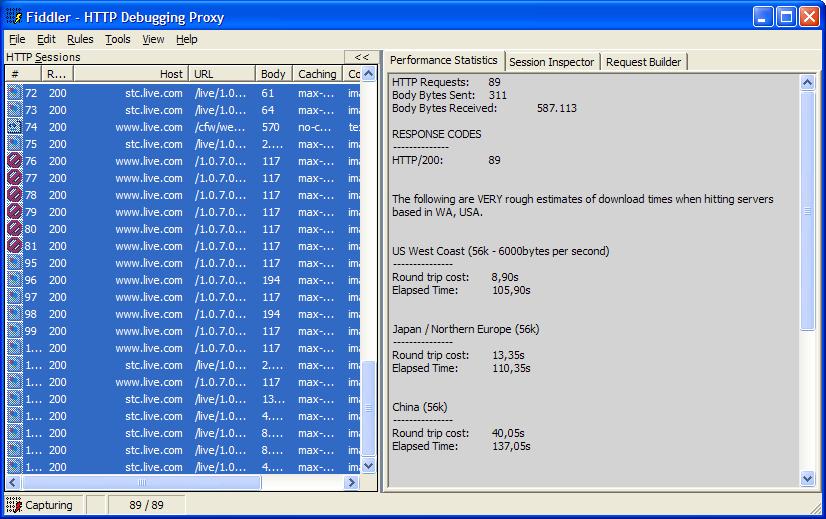
When selecting all requests I get about 89 requests at all including all HTML, CSS and JavaScript files, including all images are used for initial display. Switching to the Performance Statistics tab I can see that the client received about 587.113 bytes. If you add the HTTP header for the request and response (each around 500 bytes, depends on the cookie values) you will have a total size about 678.113 bytes.
If you are using a 28,8 modem (3.600 bytes/sec) you will need more than 3 minutes to show this page. I'm currently searching for a tool that will restrict the bandwidth use when accessing a web site (maybe as HTTP proxy) to see current web sites running on slow connections. Yes, you can use ZIP compressing for all the files, and this will speed up the request, of course!
If I think on old days where I was working for an internet agency we used web sites that returned us the total size of each page showing details for all objects (CSS, JavaScript, images,...) used on the page. If you use this the web page analyzer [3] from WebSiteOptimization.com for Live.com your will see a big difference in the total size.
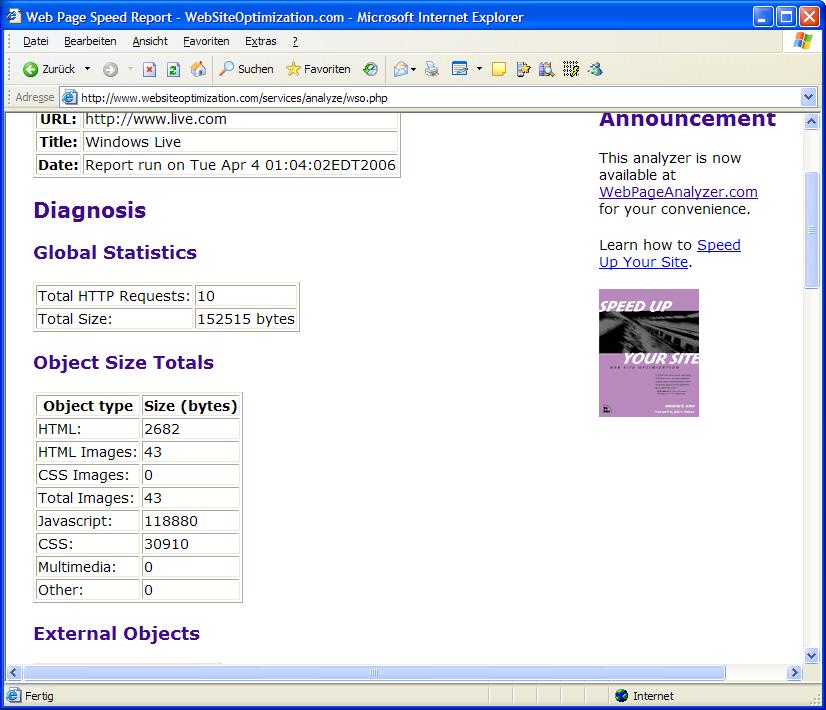
Why do we have this difference? The reason is that Live.com is already using the ATLAS library which will load more files when the page is loading. If you disable JavaScript on your web browser the web page will return only the search bar with a total of about 78.000 bytes.